Full-Year Results Fiscal Year 2017/18 of the Barry Callebaut Group
Full-Year Results Fiscal Year 2017/18 of the Barry Callebaut Group
-
Sales volume up +6.3%, well above the market growth1, first time over 2 million tonnes
- Sales revenue of CHF 6.9 billion, up +0.1% in local currencies (+2.1% in CHF)
- Operating profit (EBIT, recurring) up +21.2% in local currencies (+25.3% in CHF)
- Net profit (recurring) up +31.0% in local currencies (+35.9% in CHF)
- Free cash flow of CHF 311.9 million
- On track to deliver on mid-term guidance2
- Board member James (Jim) Donald will not stand for reelection. Suja Chandrasekaran, Angela Wei Dong and Markus Neuhaus proposed as new Board members
- Proposed payout to shareholders of CHF 24.00 per share, up +20.0%
I am delighted to announce a set of very strong results. The consistent execution of our ‘smart growth’ strategy enabled all our Regions and Product Groups to contribute to top- and bottom-line, delivering on our mid-term guidance (2).

Group Key Figures
|
for the fiscal year |
|
|
2017/18 |
2016/173 |
||
|
|
|
Change in % |
|
|
||
|
|
|
in local currencies |
|
in CHF |
|
|
|
|
|
|
|
|
|
|
|
Sales volume |
Tonnes |
|
|
6.3% |
2,035,857 |
1,914,311 |
|
Sales revenue |
CHF m |
0.1% |
|
2.1% |
6,948.4 |
6,805.2 |
|
Gross profit |
CHF m |
17.2% |
|
20.7% |
1,157.1 |
958.8 |
|
Operating profit (EBIT) |
CHF m |
16.4% |
|
20.4% |
554.0 |
460.2 |
|
Operating profit (EBIT, recurring) |
CHF m |
21.2% |
|
25.3% |
554.0 |
442.1 |
|
EBIT per tonne (recurring) |
CHF |
14.0% |
|
17.8% |
272.1 |
230.9 |
|
Net profit for the year |
CHF m |
22.5% |
|
27.1% |
357.4 |
281.1 |
|
Net profit for the year (recurring) |
CHF m |
31.0% |
|
35.9% |
357.4 |
263.0 |
|
Free cash flow |
CHF m |
(38.2%) |
|
(34.4%) |
311.9 |
475.6 |
In fiscal year 2017/18 (ended August 31, 2018) the Barry Callebaut Group – the world’s leading manufacturer of high-quality chocolate and cocoa products – increased its sales volume by +6.3% to 2,035,857 tonnes, significantly above the growth rate of the global chocolate confectionery market (+1.8%)1. Growth was broadly based with strong contributions from all key growth drivers: Emerging Markets (+9.1%), Gourmet & Specialties (+7.7%) and Outsourcing (+5.6%). Global Cocoa achieved a solid volume growth of +3.9%.
Sales revenue was flat, +0.1% in local currencies (+2.1% in CHF), at CHF 6,948.4 million, as a result of lower raw material prices, which the Group passes on to its customers for a large part of its business.
Gross profit improved by +17.2% in local currencies (+20.7% in CHF) to CHF 1,157.1 million. This increase was driven by volume growth and a better product and customer mix across all Regions and Product Groups.
Operating profit (EBIT, recurring) increased by +21.2% in local currencies (+25.3% in CHF) to CHF 554.0 million. The increase was supported by all Regions and Product Groups and outpaced volume growth. The Group had a strong EBIT per tonne performance of CHF 272.1, an increase of +14.0% in local currencies (+17.8% in CHF).
Net profit for the year (recurring) grew by +31.0% in local currencies (+35.9% in CHF) to CHF 357.4 million. This increase can be attributed to the strong EBIT growth, as well as lower net finance costs, and despite higher income tax expenses due to a one-off impact of tax reforms in Belgium and the US.
Net working capital increased to CHF 1,074.4 million, compared to CHF 1,042.5 million in prior year. The increase is largely in line with the Group’s growth. The effect of higher inventory, trade receivables and other current assets and somewhat lower trade payables and other current liabilities was largely offset by a corresponding increase in net derivative financial liabilities.
Free cash flow4 amounted to CHF 311.9 million, compared to an exceptionally strong CHF 475.6 million in the previous fiscal year, which had benefited from decreasing cocoa bean prices and some positive one-off items.
As a result, net debt was further reduced to CHF 1,074.3 million (-3.3%) from CHF 1,110.9 million in the prior year.
Outlook – Continued execution of the ‘smart growth’ strategy
Looking ahead, CEO Antoine de Saint-Affrique said: “The continued execution of our ‘smart growth’ strategy, good visibility on volume growth and healthy global demand give us confidence that we are well on track to achieve our mid-term guidance5.”
Regional/Segment performance
Region EMEA – Strong growth continued
Barry Callebaut’s sales volume in region EMEA increased by +6.8% to 925,144 tonnes while the chocolate confectionery market grew by +1.9%6. In Western Europe, sales volume growth was strong as a result of good growth within both Food Manufacturers and Gourmet. In EEMEA (Eastern Europe, Middle East, Africa) sales volume recorded a strong double-digit increase driven by Gourmet and Food Manufacturers as well as a diversification of the customer base. Sales revenue in EMEA was flat at +0.0% in local currencies (+5.9% in CHF) and amounted to CHF 3,073 million. Operating profit (EBIT, recurring) was up +11.2% in local currencies (+18.1% in CHF) to CHF 352.0 million, driven by the strong volume growth and a good product mix. Barry Callebaut successfully closed the acquisition of D’Orsogna Dolciaria, a leading specialties and decorations player, in October 2017. The recently announced acquisition and a new long-term supply agreement signed in September 2018 underline the growth potential in the mostly mature European chocolate and confectionery markets.
Region Americas – Solid top- and bottom-line performance, investing for growth
Barry Callebaut’s sales volume in Region Americas increased by +6.0% to 549,287 tonnes, well ahead of the regional market growth of +0.7%7. Sales revenue rose +3.3% in local currencies (+1.9% in CHF) to CHF 1,701 million. Operating profit (EBIT) for the region was up +9.2% in local currencies (+8.1% in CHF) to CHF 173.4 million, reflecting a favorable product mix and strong operational performance. Barry Callebaut successfully closed the acquisition of Gertrude Hawk Ingredients, a leading specialties and decorations player, in December 2017, and completed several expansions of its existing Americas factories, totaling more than CHF 30 million. The expansions will drive growth by increasing the Group’s footprint in the region and enhance its capabilities for value-adding specialty products.
Region Asia Pacific – Continued strong double-digit growth
Barry Callebaut’s sales volume increase of +16.2% to 105,777 tonnes was again significantly ahead of the regional chocolate confectionery market, which grew by +4.9%7. The Group’s strong sales performance was supported across the region with particularly good growth in China, Japan and Indonesia. Sales revenue rose by +6.6% in local currencies (+6.4% in CHF) to CHF 370.0 million. Operating profit (EBIT) grew by +20.2% in local currencies (+20.4% in CHF) to CHF 46.6 million, driven by the strong volume growth and a strong Gourmet business. Barry Callebaut invested in the expansion of its chocolate production capacity in Singapore.
Global Cocoa – Healthy growth continued
Sales volume to third-party customers increased by a healthy +3.9%, reaching 455,649 tonnes. The Group’s continued efforts on premiumizing its cocoa products range have resulted in improved growth and profitability. Sales revenue declined by –3.8% in local currencies (–4.4% in CHF) to CHF 1,805 million, due to lower average prices of cocoa products. Operating profit (EBIT) further improved by +28.3% in local currencies (+30.7% in CHF) to CHF 84.8 million, benefiting from the Cocoa Leadership project that has been completed and has delivered on its objectives as well as from favorable conditions in the cocoa products market.
Raw material price developments
Over the course of fiscal year 2017/18, cocoa bean prices increased by +10.9%, from GBP 1,524 per tonne on September 1, 2017 to GBP 1,688 per tonne on August 31, 2018. However, the average cocoa bean price for fiscal year 2017/18 was -6.8% lower than the average bean price in 2016/17 due to a more balanced cocoa bean crop. World market sugar prices decreased by -13.9% in 2017/18, due to a global surplus crop. Dairy prices started to weaken in the beginning of 2017/18 due to record level deliveries, but a rebound in price levels caused by the warm summer 2018 in Europe made the overall price development flat.
Strategic milestones achieved in fiscal year 2017/18
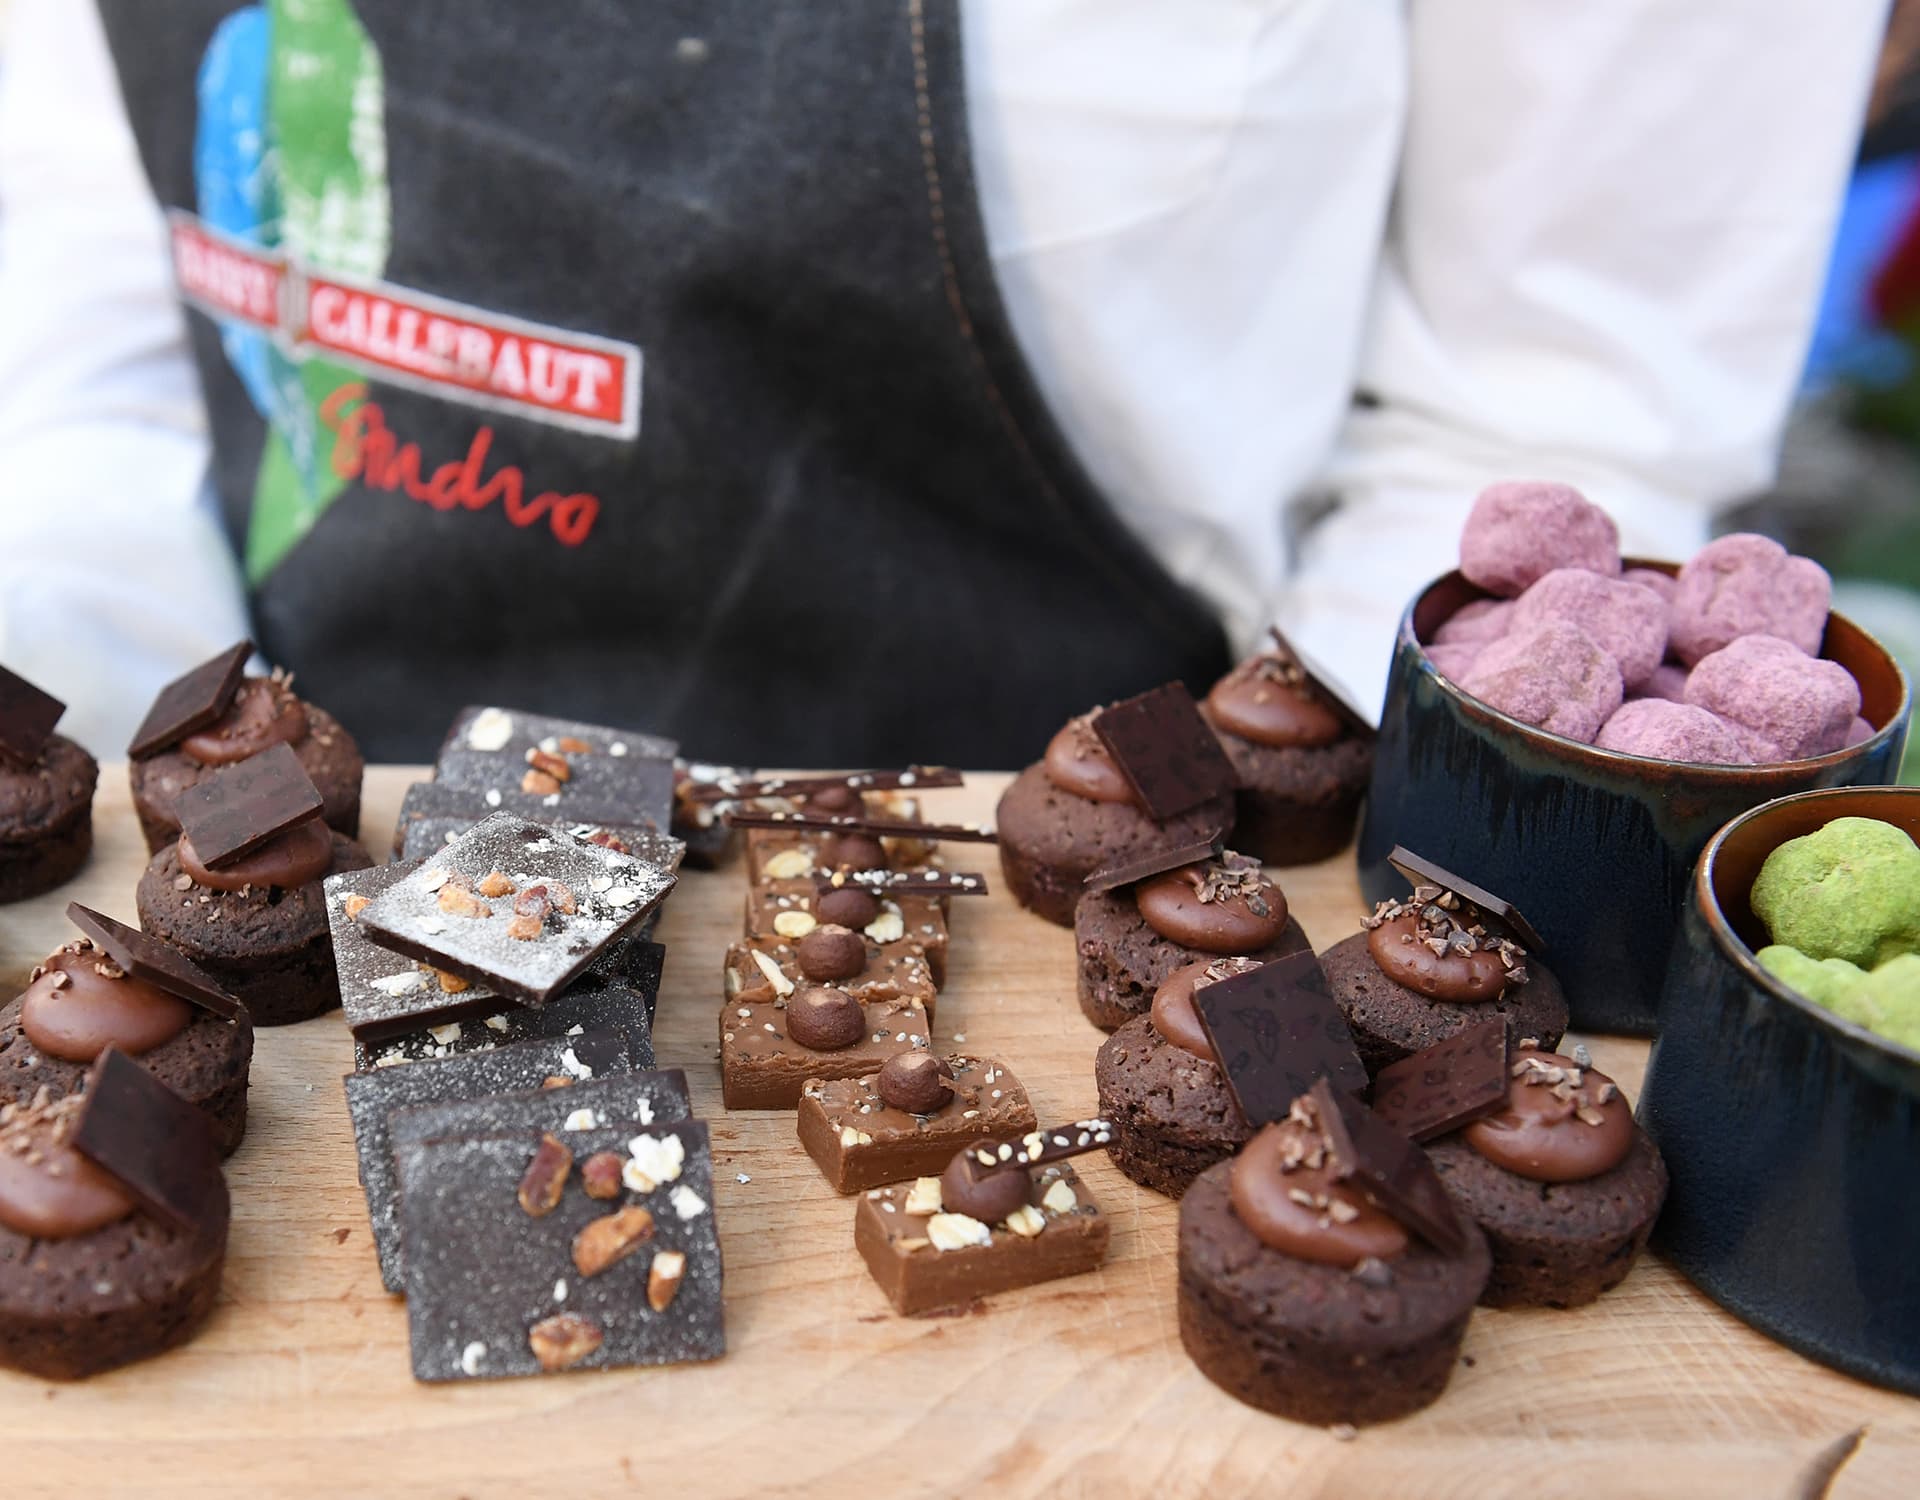
“Expansion”: The integration of the acquisitions of D'Orsogna Dolciaria in Italy, closed in October 2017, and Gertrude Hawk Ingredients in the US, closed in December 2017, further expanding Barry Callebaut’s value-adding Specialties & Decorations business, is well on track. In May 2018, Barry Callebaut opened its first CHOCOLATE ACADEMY™ Center on the African continent – its 21st globally – in Johannesburg, South Africa. The investments in South Africa and further extensions of its cocoa processing capacities in Côte d’Ivoire and Cameroon reaffirm the Group’s commitment to the African continent. Furthermore, to keep serving its customers optimally, Barry Callebaut invested in the expansion of its global chocolate production capacities in the Regions Americas and EMEA and in Singapore.
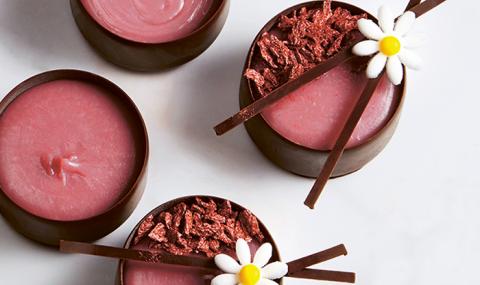
“Innovation”: Since its global launch in Shanghai in September 2017, ruby, the fourth type of chocolate, has been warmly welcomed by Barry Callebaut’s customers and has been making waves in consumer markets across the world. The iconic KitKat brand launched Sublime Ruby in Japan, South Korea, several European markets and Australia. After the introduction of the finest Belgian Ruby RB1 chocolate under the Callebaut brand in March 2018, Barry Callebaut launched Ruby Rubina under its Swiss Carma brand in May 2018. Furthermore, Barry Callebaut announced the extension of its dairy-free chocolate product portfolio in the US, tapping into growing customer demand for dairy-free chocolate. In addition, Barry Callebaut’s sugar-reduced solutions are enticing customers and growing by double-digits. Last but not least, Callebaut introduced a sensory language and tasting ritual for chocolate in January 2018, which enables brands and artisans to help consumers appreciate chocolate even more than they do today.
“Sustainability”: In fiscal year 2017/18 Barry Callebaut launched a number of unprecedented initiatives in support of its Forever Chocolate plan to make sustainable chocolate the norm by 2025. In 2017/18, the group sourced 44.0% (vs. 36.0% in prior year) of its cocoa and 44.0% (vs. 30.0% in prior year) of its other chocolate ingredients from sustainable sources. Barry Callebaut was one of the driving forces behind the signing of the Cocoa and Forests Initiative at the UN Climate Summit in Bonn in November 2017, bringing together the leading cocoa and chocolate companies, NGOs and the Ivorian and Ghanaian governments to commit to eradicating deforestation from the cocoa supply chain in West Africa. In addition, the Group is building datasets with detailed location, agronomic, economic and social survey data on already over 130,000 cocoa farms in its supply chain. These unique datasets allow Barry Callebaut to create tailor-made sustainability programs to solve the key issues of the mapped cocoa farming communities. In addition, Barry Callebaut developed pilot projects in five key cocoa sourcing countries, Côte d’Ivoire, Ghana, Cameroon, Brazil and Indonesia, to build a model of what sustainable cocoa farming in these countries entails. Furthermore, Barry Callebaut organized the fourth CHOCOVISION conference in June 2018, bringing together over 200 business leaders and key stakeholders in the chocolate and cocoa industry.
Other developments
- Significant transactions: A long-term supply agreement with Burton’s Biscuit Company, the UK’s second largest biscuit manufacturer, in September 2018 and the recently announced acquisition of Inforum, a leading B2B chocolate manufacturer in Russia, the world’s second largest chocolate confectionery market, support Barry Callebaut’s growth ambition in Region EMEA. Both transactions are subject to closing conditions and regulatory approvals and are expected to be closed by the end of calendar year 2018.
- Credit ratings: Moody’s Investor Service (Moody’s), one of the most important providers of credit ratings, upgraded Barry Callebaut’s long-term issuer rating to Baa3 investment grade, up from Ba1. At the same time, all senior unsecured ratings assigned to the bonds issued by Barry Callebaut Services N.V. have also been upgraded to Baa3, up from Ba1. The upgrade of Barry Callebaut’s rating to investment grade reflects the company’s improvements in operating performance and financial metrics.
Restatement of prior year comparatives8
As part of its ongoing process and system improvement initiatives, the Group undertook a detailed review of its intercompany transactions. Extensive flows of goods between subsidiaries are typical for companies with a fully vertically integrated value chain such as Barry Callebaut. As a result of this in-depth review, some improvements were required to the intercompany profit elimination process along the value chain. In accordance with IAS 8.41f, the Group has adjusted its prior year Consolidated Financial Statements accordingly. The amounts adjusted represent merely a timing mismatch of profit recognition. These adjustments do not have an impact on the Group’s Cash generated from operating activities or Free cash flow and have no material impact on the Group’s financial position, performance and key figures / ratios. They also do not have an impact on the Group’s outlook for 2018/19, nor its mid-term financial guidance for the period 2015/16
to 2018/19.
Proposals to the Annual General Meeting (AGM)
Payout to shareholders
The Board of Directors is proposing a payout to shareholders of CHF 24.00 per share at the Annual General Meeting of Shareholders on December 12, 2018, an increase of +20.0% versus prior year. This represents a payout ratio of 37% of the net profit. The dividend will be paid to shareholders on or about January 9, 2019, subject to approval by the Annual General Meeting of Shareholders.
Board of Directors
James (Jim) L. Donald, Board member since 2008 and Chairman of the Nomination & Compensation Committee, has decided to step down from these functions at the Annual General Meeting of Shareholders 2018 following his recent appointment to President & CEO of Albertsons Companies, one of the largest supermarket chains in North America. The Board of Directors would like to express its sincere gratitude to Jim Donald for his unmatched expertise as a retail veteran and for his valuable impulses to Barry Callebaut’s people agenda.
The Board of Directors will propose Suja Chandrasekaran, Markus Neuhaus and Angela Wei Dong as new Board members.

Suja Chandrasekaran (national of Australia, India and the US), is a technology executive. She currently serves as Chief Information and Digital Officer of Kimberly-Clark (K-C) where she is part of the leadership team and leads all technology, digital, data applications and cyber security capabilities globally.

Angela Wei Dong (Chinese national), has deep expertise in Chinese retail business. She currently serves as General Manager Greater China for Nike Inc. and has P&L responsibility for a USD 5 billion business.
Markus R. Neuhaus (Swiss national), is a proven expert in law and corporate tax. He is currently Chairman of the Board of PwC Switzerland and a member of the Supervisory Board of PwC Europe SE (Germany, Netherlands, Belgium, Austria, Turkey). He joined PwC in 1985 and became a Partner in 1992.
All other members of the Board will stand for re-election for another term of office of one year.
Further information is available in the following publications available as of today:
- Annual Report 2017/18 (micro-)website: www.barry-callebaut.com/annual-report
- Annual Report 2017/18 (PDF)
- Short Report 2017/18 English and German
1 Source: Nielsen, +1.8% in volume for the period August 2017 to August 2018 – 25 countries.
2 On average for the 4-year period 2015/16 to 2018/19: 4–6% volume growth and EBIT above volume growth in local currencies, barring any major unforeseen events.
3 Refer to page 5, Restatement of prior year comparatives, and to page 9, Appendix 1.
4 Net cash flow from operating activities / Net cash flow from investing activities, excluding acquisitions.
5 On average for the 4-year period 2015/16 to 2018/19: 4–6% volume growth and EBIT above volume growth in local currencies, barring any major unforeseen events.
6 Source: Nielsen, Chocolate confectionery sales in volume, from August 2017 to August 2018.
7 Source: Nielsen, Chocolate confectionery sales in volume, from August 2017 to August 2018.
8 See page 48 of the Annual Report 2017/18, Summary of Accounting Policies – Restatement and reclassification of prior year comparatives.
|
Media and Analysts / Institutional Investors’ conferences of the Barry Callebaut Group |
|
|
Date: |
Wednesday, November 7, 2018 |
|
Location: |
Barry Callebaut Head Office, CHOCOLATE ACADEMYTM Center, |
|
Time: |
Media: 09.30 am to 10.30 am CET Analysts/Institutional Investors: 11.30 am to approx. 1 pm CET (followed by light lunch) |
|
The conference can be followed via telephone or audio webcast. All dial-in and access details can be found on the Barry Callebaut Group’s website (via the links below) |
|
|
Financial Calendar for Fiscal Year 2018/19 (September 1, 2018 to August 31, 2019): |
|
|
Annual General Meeting 2017/18 |
December 12, 2018 |
|
3-month key sales figures 2018/19 |
January 23, 2019 |
|
Half-year results 2018/19 |
April 11, 2019 |
|
Investor Day |
April 16-17, 2019 |
|
9-month key sales figures 2018/19 |
July 11, 2019 |
|
Full-year results 2018/19 |
November 6, 2019 |
|
Annual General Meeting 2018/19 |
December 11, 2019 |
About Barry Callebaut Group:
With annual sales of about CHF 6.9 billion (EUR 6.0 billion / USD 7.1 billion) in fiscal year 2017/18, the Zurich-based Barry Callebaut Group is the world’s leading manufacturer of high-quality chocolate and cocoa products – from sourcing and processing cocoa beans to producing the finest chocolates, including chocolate fillings, decorations and compounds. The Group runs about 60 production facilities worldwide and employs a diverse and dedicated global workforce of more than 11,500 people.
The Barry Callebaut Group serves the entire food industry, from industrial food manufacturers to artisanal and professional users of chocolate, such as chocolatiers, pastry chefs, bakers, hotels, restaurants or caterers. The two global brands catering to the specific needs of these Gourmet customers are Callebaut® and Cacao Barry®.
The Barry Callebaut Group is committed to make sustainable chocolate the norm by 2025 to help ensure future supplies of cocoa and improve farmer livelihoods. It supports the Cocoa Horizons Foundation in its goal to shape a sustainable cocoa and chocolate future.
Barry Callebaut Group - Presentation of Annual Results for the fiscal year 2017/18
Barry Callebaut Group - Annual Results for the fiscal year 2017/18 from Barry Callebaut
Barry Callebaut Short Report 2017/18
Barry Callebaut Annual Report 2017/18
Group Key Figures
|
for the fiscal year |
|
|
2017/18 |
2016/17 |
||
|
|
|
Change in % |
|
|
||
|
|
|
in local currencies |
|
in CHF |
|
|
|
By Region |
|
|
|
|
|
|
|
EMEA |
|
|
|
|
|
|
|
Sales volume |
Tonnes |
|
|
6.8% |
925,144 |
866,498 |
|
Sales revenue |
CHF m |
0.0% |
|
5.9% |
3,072.5 |
2,900.2 |
|
EBITDA (recurring) |
CHF m |
12.6% |
|
19.5% |
414.3 |
346.7 |
|
Operating profit (EBIT, recurring) |
CHF m |
11.2% |
|
18.1% |
352.0 |
298.1 |
|
Americas |
|
|
|
|
|
|
|
Sales volume |
Tonnes |
|
|
6.0% |
549,287 |
518,359 |
|
Sales revenue |
CHF m |
3.3% |
|
1.9% |
1,700.6 |
1,668.7 |
|
EBITDA |
CHF m |
12.9% |
|
11.9% |
213.6 |
191.0 |
|
Operating profit (EBIT) |
CHF m |
9.2% |
|
8.1% |
173.4 |
160.4 |
|
Asia Pacific |
|
|
|
|
|
|
|
Sales volume |
Tonnes |
|
|
16.2% |
105,777 |
91,020 |
|
Sales revenue |
CHF m |
6.6% |
|
6.4% |
370.0 |
347.9 |
|
EBITDA |
CHF m |
19.3% |
|
19.5% |
57.0 |
47.7 |
|
Operating profit (EBIT) |
CHF m |
20.2% |
|
20.4% |
46.6 |
38.7 |
|
Global Cocoa |
|
|
|
|
|
|
|
Sales volume |
Tonnes |
|
|
3.9% |
455,649 |
438,434 |
|
Sales revenue |
CHF m |
(3.8%) |
|
(4.4%) |
1,805.2 |
1,888.3 |
|
EBITDA |
CHF m |
12.4% |
|
14.7% |
142.7 |
124.4 |
|
Operating profit (EBIT) |
CHF m |
28.3% |
|
30.7% |
84.8 |
64.9 |
|
By Product Group |
|
|
|
|
|
|
|
Sales volume |
Tonnes |
|
|
|
2,035,857 |
1,914,311 |
|
Cocoa Products |
Tonnes |
|
|
3.9% |
455,649 |
438,434 |
|
Food Manufacturers Products |
Tonnes |
|
|
7.0% |
1,338,311 |
1,251,237 |
|
Gourmet & Specialties Products |
Tonnes |
|
|
7.7% |
241,897 |
224,640 |
|
Sales revenue |
CHF m |
|
|
|
6,948.4 |
6,805.2 |
|
Cocoa Products |
CHF m |
(3.8%) |
|
(4.4%) |
1,805.2 |
1,888.3 |
|
Food Manufacturers Products |
CHF m |
0.9% |
|
3.9% |
3,979.9 |
3,829.4 |
|
Gourmet & Specialties Products |
CHF m |
4.1% |
|
7.0% |
1,163.2 |
1,087.4 |
Appendix 1: Group Key Figures
|
for the fiscal year |
|
|
|
2017/18 |
2016/17 |
2016/17 |
||||
|
|
|
Change % (restated)2 |
Change % (reported) |
|
restated2 |
reported |
||||
|
|
|
in local currencies |
|
in CHF |
in local currencies |
|
in CHF |
|
|
|
|
Consolidated Income Statement |
|
|
|
|
|
|
|
|
|
|
|
Sales volume |
Tonnes |
|
|
6.3% |
|
|
6.3% |
2,035,857 |
1,914,311 |
1,914,311 |
|
Sales revenue |
CHF m |
0.1% |
|
2.1% |
0.1% |
|
2.1% |
6,948.4 |
6,805.2 |
6,805.2 |
|
EBITDA (recurring) |
CHF m |
19.1% |
|
23.0% |
14.2% |
|
17.5% |
728.3 |
592.1 |
620.0 |
|
Operating profit (EBIT) |
CHF m |
16.4% |
|
20.4% |
9.8% |
|
13.5% |
554.0 |
460.2 |
488.2 |
|
Operating profit (EBIT, recurring) |
CHF m |
21.2% |
|
25.3% |
14.0% |
|
17.8% |
554.0 |
442.1 |
470.1 |
|
EBIT (recurring) / sales revenue |
% |
|
|
22.7% |
|
|
15.6% |
8.0% |
6.5% |
6.9% |
|
EBIT per tonne (recurring) |
CHF |
14.0% |
|
17.8% |
7.2% |
|
10.8% |
272.1 |
230.9 |
245.6 |
|
Net profit for the year |
CHF m |
22.5% |
|
27.1% |
14.7% |
|
18.0% |
357.4 |
281.1 |
302.9 |
|
Net profit for the year (recurring) |
CHF m |
31.0% |
|
35.9% |
22.0% |
|
25.5% |
357.4 |
263.0 |
284.8 |
|
Free cash flow |
CHF m |
(38.2%) |
|
(34.4%) |
(37.5%) |
|
(34.4%) |
311.9 |
475.6 |
475.6 |
|
Consolidated Balance Sheet |
|
|
|
|
|
|
|
|
|
|
|
Total assets |
CHF m |
|
|
6.7% |
|
|
5.4% |
5,832.0 |
5,466.5 |
5,534.1 |
|
Net working capital |
CHF m |
|
|
3.1% |
|
|
(4.9%) |
1,074.4 |
1,042.5 |
1,129.5 |
|
Non-current assets |
CHF m |
|
|
1.1% |
|
|
1.9% |
2,505.5 |
2,477.7 |
2,458.2 |
|
Net debt |
CHF m |
|
|
(3.3%) |
|
|
(3.3%) |
1,074.3 |
1,110.9 |
1,110.9 |
|
Shareholders’ equity |
CHF m |
|
|
7.5% |
|
|
4.2% |
2,269.8 |
2,111.2 |
2,178.7 |
|
Capital expenditure |
CHF m |
|
|
(1.1%) |
|
|
(1.1%) |
217.9 |
220.4 |
220.4 |
|
Ratios |
|
|
|
|
|
|
|
|
|
|
|
Economic Value Added (EVA) |
CHF m |
|
|
72.1% |
|
|
45.1% |
173.3 |
100.7 |
119.4 |
|
Return on invested capital (ROIC) |
% |
|
|
20.2% |
|
|
14.8% |
13.3% |
11.0% |
11.5% |
|
Return on equity (ROE) |
% |
|
|
26.4% |
|
|
20.5% |
15.7% |
12.5% |
13.1% |
|
Debt to equity ratio |
% |
|
|
(10.1%) |
|
|
(7.2%) |
47.3% |
52.6% |
51.0% |
|
Solvency ratio |
% |
|
|
0.8% |
|
|
(1.1%) |
38.9% |
38.6% |
39.4% |
|
Interest coverage ratio |
|
|
|
46.9% |
|
|
41.2% |
7.2 |
4.9 |
5.1 |
|
Net debt / EBITDA |
|
|
|
(21.4%) |
|
|
(17.7%) |
1.5 |
1.9 |
1.8 |
|
Capital expenditure / sales revenue |
% |
|
|
(3.2%) |
|
|
(2.0%) |
3.1% |
3.2% |
3.2% |
|
Shares |
|
|
|
|
|
|
|
|
|
|
|
Share price at fiscal year-end |
CHF |
|
|
25.2% |
|
|
25.2% |
1,728 |
1,380 |
1,380 |
|
EBIT (recurring) per share |
CHF |
|
|
25.3% |
|
|
17.8% |
101.0 |
80.6 |
85.7 |
|
Basic earnings (recurring) per share |
CHF |
|
|
35.6% |
|
|
25.0% |
64.9 |
47.8 |
51.9 |
|
Cash earnings per share |
CHF |
|
|
(34.4%) |
|
|
(34.4%) |
56.9 |
86.7 |
86.7 |
|
Payout per share |
CHF |
|
|
20.0% |
|
|
20.0% |
24.0 |
20.0 |
20.0 |
|
Payout ratio |
% |
|
|
(5.4%) |
|
|
2.8% |
37% |
39% |
36% |
|
Price-earnings ratio at year-end |
|
|
|
(7.9%) |
|
|
0.0% |
26.6 |
28.9 |
26.6 |
|
Market capitalization at year-end |
CHF m |
|
|
25.2% |
|
|
25.2% |
9,484.7 |
7,574.6 |
7,574.6 |
|
Number of shares issued |
|
|
|
0.0% |
|
|
0.0% |
5,488,858 |
5,488,858 |
5,488,858 |
|
Total payout to shareholders |
CHF m |
|
|
29.0% |
|
|
29.0% |
109.8 |
85.1 |
85.1 |
|
Other |
|
|
|
|
|
|
|
|
|
|
|
Employees |
|
|
|
9.9% |
|
|
9.9% |
11,570 |
10,528 |
10,528 |
1 For the definition of Key Figures, please refer to 5-Year Overview in the Annual Report 2017/18, page 11.
2 See page 48 of the Annual Report 2017/18, Summary of Accounting Policies – Restatement and reclassification of prior year comparatives.
Available downloads
- Press Release - English
- Press Release - Français
- Press Release - Deutsch
- Barry Callebaut Annual Report 2017/18
- Barry Callebaut Short Report - Deutsch
- Barry Callebaut Short Report - English
- Presentation Full-Year Results 2017/18
- CV Suja Chandrasekaran - English
- CV Suja Chandrasekaran Deutsch
- CV Suja Chandrasekaran - Français
- CV Angela Wei Dong - English
- CV Angela Wei Dong - Deutsch
- CV Angela Wei Dong - Français
- CV Markus R. Neuhaus - English
- CV Markus R. Neuhaus - Deutsch
- CV Markus R. Neuhaus - Français
Media assets
-
 https://www.barry-callebaut.com/sites/default/files/styles/paragraph_image_gallery_full/public/2021-05/antoine_de_saint-affrique.jpg?itok=VJuwlUzH
 -
 https://www.barry-callebaut.com/sites/default/files/styles/paragraph_image_gallery_full/public/2021-05/remco_j.steenbergen%20%281%29.jpg?itok=0YmwkUeP
 -
 https://www.barry-callebaut.com/sites/default/files/styles/paragraph_image_gallery_full/public/2021-05/ruby_4th_type_of_chocolate.jpg?itok=zdvRIVjg
 -
 https://www.barry-callebaut.com/sites/default/files/styles/paragraph_image_gallery_full/public/2019-01/barry_callebaut_innovation_chocolate_0.jpg?itok=e8qQqry2
 -
 https://www.barry-callebaut.com/sites/default/files/styles/paragraph_image_gallery_full/public/2021-05/barry_callebaut_chocolate.jpg?itok=EREk7i2q